
An Ounce of Retention…
We have recently noticed a shift in the questions institutions are asking us to help with. While most of our market research focuses on enrolling new students, retaining current students has become a larger part of the conversation. The specific questions vary by institution, but the underlying concern is consistent: Why do students leave, and what can we do to help them stay?
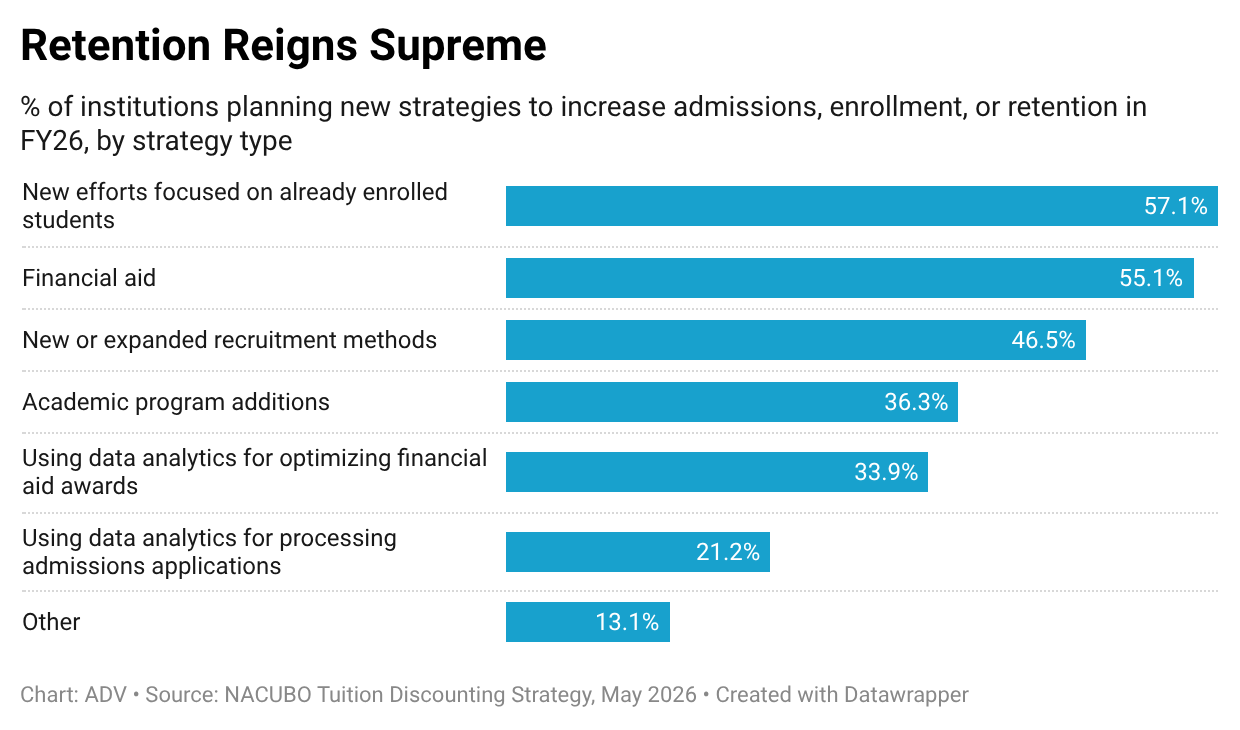
Our experience is consistent with what business officers say their institutions are doing to increase enrollment. In NACUBO’s 2026 survey, “new efforts focused on already enrolled students” was the most common strategy being employed to sustain enrollment:
Helping students stay enrolled and graduate has always been central to higher education’s mission. But there may be a stronger business case for it today than in the past. Against the demographic reality of declining high school graduates, it becomes even more important to hold on to those who enroll.
That makes it worth asking how well institutions are retaining students, how that has changed over time, and what can be learned from those who do it well.
To investigate, we analyzed retention and graduation data for four-year institutions with at least one thousand students. The results are quite varied and paint a nuanced picture:
Retention rates are a mixed bag. In the most recent ten-year period with available data, average first-to-second year retention held steady at 76% across four-year institutions. Nearly half (48%) of the 1,261 institutions in the analysis increased retention over the time…but a similar proportion (49%) decreased.
Privates edge publics, but… On balance, private non-profit colleges retain students better than public universities (78% vs. 74%). However, publics increased retention by 0.8 percentage points over the prior decade while privates decreased by 0.5.
Larger universities have pulled ahead. Universities with more than 20,000 students had an average retention rate of 85%, compared with 74% among colleges with 1,000–2,499 students. The gap also widened over the decade: retention rose by 1.3 percentage points at the largest institutions and fell by 0.7 points at the smallest.
Starting points matter. Institutions that began the decade with the lowest retention rates saw the largest increases. Those that started with the highest rates generally made smaller gains, and some lost ground.
The data points to implications for how institutions approach increasing retention and persistence:
Smaller school brand promise. There is a market expectation that the smaller classes, personal attention, and faculty/staff mentorship at smaller schools contribute to student success. Many smaller schools claim this explicitly. The data, however, show that smaller schools on average retain students at lower rates than larger universities. While retention rates alone cannot tell us how well a college delivers on that promise, they can prompt useful questions about whether students are receiving the support they expected, where they encounter obstacles, and who is being missed. For those with low retention rates, keeping students enrolled is not just a business imperative, it is also fundamental to fulfilling the promise made to prospective students and families.
Learn from others’ successes. Larger institutions are a retention and persistence success story as they retain and graduate students at far higher rates than the national average. These stronger results are worth examining. What are they doing to identify students who need help, connect them with support, and address recurring obstacles? While the resources and students at larger universities may different from medium or small colleges, some practices may be adaptable. The useful question is which approaches could work in your institution’s context.
What got you here won’t get you there. It has been said that it’s easier to go from 70% retention to 80% than to go from 80% to 90%. These results affirm that – the higher an institution’s retention rate gets, the harder it is to increase from there. It is important, firstly, to recognize that fact when leadership teams set retention and persistence targets. It is also critical to recognize that leveling up from the current state will likely require different strategies than you’ve used to get to where you are.
I’ve always believed that good research not only answers questions, it also leads to asking better ones. In that spirit, we’re sharing the data from this analysis so that you can ask different questions as well (link). For example:
How did Florida International University raise retention from 83% to 92% while nearly half of students are Pell eligible?
What did the University of Evansville do to raise graduation rates by 20 percentage points in just ten years?
For your institution, a useful starting point may be a college serving similar students that has made meaningful progress. A conversation about what changed, what helped, and what proved difficult could surface an idea worth trying.
There is good reason to be encouraged by these examples. They show that progress is possible. And when it comes to retention and persistence, even a modest improvement means more institutional revenue, greater mission fulfillment, and more students finishing what they came to college to do.